IT'S A NEW DAY
CREATE NEW VALUE FROM YOUR DATA TODAY
newData offers an inclusive suite of data-driven solutions
newData's suite of data-driven solutions:
Search Engine Optimization
SEO
Increase your website's traffic organically
Increase your website's traffic organically
Predictive
Analytics Analytics
Analytics Analytics
Anticipate the future for competitive advantage
Anticipate the future for competitive advantage
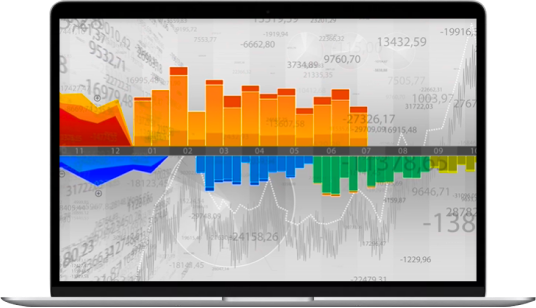
Data
Visualization Visualization
Visualization Visualization
Make better decisions with intuitive dashboards
Make better decisions with intuitive dashboards
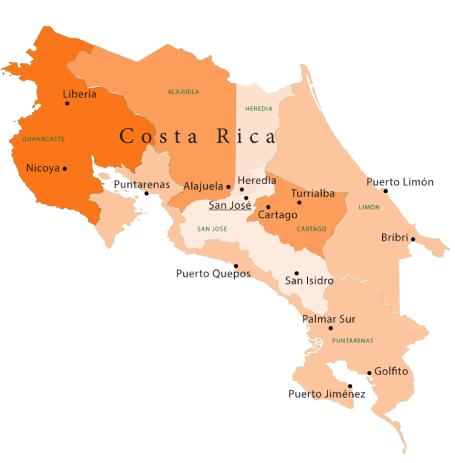
Nearshore Analytics Recruiting
Recruiting
Grow your analytics team with nearshore talent
Grow your analytics team with nearshore talent