December 27th, 2022 by Taymour
Predictive analytics helps companies understand the to forecast customer behavior. Statistical techniques or machine learning algorithms are used to create sophisticated models that uncover trends and patterns. They can also be used to accurately estimate future customer needs and preferences, allowing companies to adjust their strategies accordingly. This helps them remain competitive by increasing revenue, decreasing costs or maximizing profits.
Let’s explore some specific ways marketing professionals can use predictive analytics to gain a competitive edge.
Optimizing Marketing Campaigns
As mentioned above, a common use of predictive analytics is to maximize ROI of marketing campaigns. For example, it can be used to identify the best channels to reach a particular audience. It can also be used to optimize the timing of marketing messages so that they are most likely to be seen by the right people at the right time. Within marketing campaigns themselves, predictive analytics can be used to identify which customer segments are most likely to take advantage of a particular promotion or to purchase a specific product. It can also predict buying patterns of certain customers, allowing businesses to personalize their messaging and offers accordingly. Predictive analytics can also identify regional trends in customer buying behavior and uncover entirely new and untapped markets.
Here are some some of the specific ways predictive analysis can be deployed to help optimize marketing campaigns:
Response Modeling
A response model in marketing analytics is a statistical or machine learning model that is used to predict the likelihood that a particular individual will respond to a marketing call to action. Response models are typically used to optimize marketing campaigns by identifying the characteristics of individuals who are most likely to respond. Marketing uses this information to build personalized targeting strategies for specific customer segments (see below). Like any model, response models are only as effective as the inputs that are used to build the model – i.e, content that a customer or prospect is responding to.
Response models can be built using a variety of techniques, such as regression analysis, decision trees, or machine learning algorithms. The specific technique used will depend on the type and quality of the data available, as well as the desired level of accuracy and complexity of the model.
Response models can be used for a variety of purposes in marketing, including identifying the most promising leads, optimizing email marketing campaigns, and improving the precision of ad targeting. By analyzing data on customer characteristics, engagement behaviors, and responses to previous marketing efforts, businesses can build response models that can help them predict the likelihood that a particular individual will respond to a particular call to action. Marketers can then tailor their creative design, message, and offers accordingly.
Customer Segmentation
Customer segmentation is the process of dividing a customer base into smaller subgroups based on characteristics such as demographics, behaviors, psychographics (personality and values) aspirations or interests. By breaking customers into segments, businesses can gain a clearer understanding of their needs and then create marketing strategies that are tailored to each segment. This strategy increases the effectiveness of the overall marketing campaign.
Customers can be grouped using a variety of techniques, including:
- Demographic segmentation: Customers are grouped based on characteristics such as age, gender, income, education level, or geographic location.
- Behavioral segmentation: Customers are grouped based on their behaviors, such as their purchasing habits, loyalty, or product usage patterns.
- Psychographic segmentation: This involves dividing customers into groups based on their attitudes, values, and lifestyles.
- Firmographic segmentation: This type of segmentation groups customers based on characteristics of their organizations, such as business size, industry, or location.
- Value-based segmentation: More complex than other segmentation methods, customers are grouped based on the value they provide to the business, such as their lifetime value or their potential to purchase related or additional products or services.
Customer segmentation schemas can be built using varied data sources, such as internal customer data, market research, or publicly-available data. The specific technique used will depend on the type and quality of the data available, as well as the desired level of accuracy and complexity of the segmentation schema.
Improving Website Engagement
Predictive analytics can also be used to improve customer engagement. For example, creating personalized experiences, optimizing customer service experiences, and providing targeted content and offers. Website customer engagement refers to the level of interaction and involvement that potential customers have with a website.
There are many metrics businesses can use to understand engagement from website traffic and then make any necessary tweaks or improvements:
- Bounce rate: This is a measure of the percentage of website visitors who leave (“bounce”) after only viewing a single page and not interacting with that page. This metric can indicate how engaging a website is and how effectively it is able to retain visitors. A high bounce rate may suggest that the website is not effectively engaging, and therefore, not likely to become customers. By analyzing the bounce rate, businesses can identify areas for improvement (more relevant content, effective UX navigation, etc,) and take steps to increase engagement and conversion rates further along the sales funnel.
- Session duration: The amount of time that a visitor spends on a website during one session can be an indicator of their level of engagement. Generally, the longer a visitor spends on a website, the more engaged they are likely to be. By analyzing the session durations of different customer segments, businesses can identify the most engaging content categories and then tailor their website to better meet the needs of those customer segments.
- Pageviews per session: The number of pages that a visitor views on a website can be an indicator of their level of engagement. Generally, the more pages a visitor views on a website, the more engaged they are likely to be. By analyzing the pageviews per session that different customer segments view on the website, businesses can identify the pages that are most engaging (and to whom), promote those pages, and then eliminate pages that are not drawing the desired traffic.
- Clickthrough rate: The number of clicks that a visitor makes on links within a website can also be an indicator of their level of engagement. When visitors click on links, they are demonstrating their interest in learning more about a particular subject, product, or service. By analyzing the clickthrough rate of different customer segments, businesses can identify which links are most engaging and adjust content accordingly.
- Form submissions: Filling out a form on a website can be an indicator of a visitor’s level of engagement. Generally, visitors who fill out contact forms or add themselves to a newsletter distribution from a business’s website are interested in the products or services being promoted on the website. Businesses need to respond to these potential customers in a timely manner and provide them with the information they need to take the next step.
- Social shares: When customers share content from a website on social media or via email, this usually means that they are very interested in the subject matter and that the content has resonated with them. Hopefully, they and others will subsequently purchase products or services. By analyzing the sharing habits of different customer segments, businesses can bolster their website content in order to attract the attention of future customers and encourage them to share the website with their social networks.
Forecasting Customer Demand
Predictive analytics can be used to anticipate the demand for a particular product or service. This can be important for businesses to know because it can help them optimize their production and inventory management and to appropriately direct their marketing and sales efforts.
In order to accurately forecast demand, businesses can analyze data on past sales and customer behavior, as well as data on external factors that might impact demand, such as economic conditions, market trends, and seasonality. Using this data, businesses can build statistical or machine learning models that can make predictions about future demand.
For example, a clothing retailer might use predictive analytics to forecast demand for different types of clothing during different seasons of the year. By analyzing data on past sales and customer behavior, the retailer can then build a model that predicts how much of each type of clothing is likely to be sold in the future and when it will likely be sold. More sophisticated models can control for confounding factors like economy, weather, and competitive factors.
Retaining Customers
Retaining customers is cost-effective and a key factor in reducing CAC (see above.) Companies can develop machine learning algorithms that evaluate data on customer interactions, purchases, and other activities, such as customer service interactions in order to predict which variables are most crucial in fostering client loyalty. Conversely, predictive analytics might also be to examine information on the demographics, interests, and activities of its less loyal clients. Based on this data, the company may find that these clients are more likely to be interested in affordable apparel than high-priced designer clothing. The business could then target this particular consumer base with specific marketing activities, such as price-focused discounts or promotions.
The business can boost customer retention of its top customers, resulting in higher revenue and profitability, by focusing its marketing efforts on its most loyal customers using predictive analytics.
Identifying Churn Risk
Predictive analytics can be used to identify which customers are most likely to churn (i.e., stop using a product or service) by analyzing customer behaviors like interactions and purchases. By identifying patterns and trends associated with prior churns, businesses can utilize machine learning algorithms to make predictions about which customers are most likely to churn in the future.
Once these predictions are made, businesses can take steps to prevent churn by targeting their efforts towards the customers who are most at risk. For example, a business might offer incentives or promotions to customers who are at risk of churning or provide additional support and assistance to customers who are struggling. They may also decide to prioritize the retention of profitable customers over those customer segments who are costly for the company to retain.
In addition to helping businesses retain existing customers, identifying churn risk can also help businesses optimize their marketing efforts by focusing on acquiring new customers who are less likely to churn. By understanding which types of customers are more likely to churn, businesses can tailor their marketing and sales efforts to attract and retain more stable, long-term customers.
There are several statistical and machine learning algorithms that can predict customer churn (and, similarly, many other Marketing Optimization applications), including:
- Logistic regression: This is a type of regression analysis that is used to predict the probability of a binary (yes/no) outcome, such as whether a customer is likely to churn.
- Decision trees: This is a machine learning algorithm that uses a tree-like model to make predictions based on a series of decisions and their associated outcomes.
- Random forests: This is an ensemble machine learning algorithm that combines the predictions of multiple decision trees to make more accurate predictions.
- Support vector machines (SVMs): This is a type of algorithm that is used to classify data into different categories by finding the hyperplane (a line or a plane that separates data points into different categories) that maximizes the distance between different categories.
- Neural networks: This is a machine learning algorithm that is inspired by the structure and function of the human brain. Neural networks can be used to make predictions based on complex patterns in data. Think of it like your own brain: when you see a picture of a dog, your brain quickly recognizes it as a dog because it has learned to recognize the pattern of what a dog looks like. A neural network works similarly by learning to recognize patterns in data. It is made up of many small parts called “neurons,” and these neurons work together to process information and make decisions. When the neural network is shown an input, like a picture, each neuron performs a small calculation and passes the result to the next neuron. This continues until the final output is produced, which is the decision made by the neural network. So, in simple terms, a neural network is a computer program that can recognize patterns in data, like a human brain.
Note: As you can see, these machine learning techniques can be intricate and complex. In order to use them effectively to predict customer churn, businesses would first need to gather data on customer interactions, purchases, and other activities. This data would then be cleaned and preprocessed, and features (i.e., variables that might impact churn) would be selected and extracted. The data would then be split into training and testing sets, and the machine learning algorithm would be trained on the training set and then evaluated using the testing set. Based on the results of this evaluation, the algorithm could then be fine-tuned and used to make predictions about which customers are most likely to churn. Given this complexity, be sure to involve competent data scientists.
Optimizing the Timing of Marketing Messages
Predictive analytics can be used to optimize the timing, content, and targeting of marketing campaigns. For example, based on when they are most likely to open and respond to emails, businesses can use predictive analytics to identify the best time of day or week to send emails to a particular customer. Predictive analytics can also identify the type of content that is most likely to be of interest to a particular customer or customer segment, and then tailor their market outreach accordingly. The machine learning model would use this data to identify patterns and relationships between these factors and the timing of the offers. Then, when presented with new data, it would use what it has learned to make predictions about when the next offer is likely to occur.
In social media, predictive analytics can be used by analyzing when customers are most likely to engage with posts. Businesses can build models that identify the best time of day or week to post on a particular social media channel. Predictive analytics can also identify the specific platforms that are most effective, as well as the type of content that best engages potential customers and their influencers. Businesses can use this data to tailor their digital marketing strategies to maximize their reach and engagement. For example, if a particular target audience is more active in the evening, businesses can schedule content to be released during evening hours or create campaigns that incentivize users to engage with them at those times.
Optimizing Online Ads
Data-driven predictive analytics can help businesses better optimize their online advertising efforts, resulting in more cost-effective campaigns that generate higher returns. By applying predictive analytics to online advertisements, businesses can create targeted ad campaigns that reach the right audience at the right time in order to offer them the most relevant information or product.
For example, predictive analytics can track customers’ behavior when they view an advertisement or interact with a website. Armed with this data, businesses can adjust their marketing strategies accordingly to drive sales. This reduces waste from ads that don’t create conversions, allowing for budgets to be allocated more efficiently.
Identifying Cross-selling Opportunities
Predictive analytics can be used to identify customers who are most likely to become repeat customers and then direct appropriate marketing efforts towards them. Cross-selling is an often-used sales technique that incentivizes clients to buy additional products or services that are related to the products or services they have previously purchased. For example, as part of the reservation process, a travel website offers attractive room upgrades, rental vehicles, package deals, and travel insurance.Based on customer demand and other metrics, predictive analytics can be used to identify the ideal price points for various products or services. This practice, known as pricing analytics, is used across a wide range of industries to optimize pricing strategies, maximize revenue, and boost profitability.
Optimizing Pricing Strategies
Because of its complexity, machine learning is well suited for pricing optimization. Businesses first compile data on past sales, customer behavior, and other external factors that could impact demand. This data is then used to train machine learning algorithms which ultimately make predictions that the business can use to make adjustments in their pricing strategy so that ROI is maximized.
Machine learning is good for pricing analytics because it can automate the process of identifying patterns in large amounts of data and make predictions based on those patterns. In the context of pricing analytics, machine learning models can analyze various factors that influence the price of a product, such as market demand, competitors’ prices, supply and demand, and economic trends.
These models can also take into account customer behavior, such as their purchasing history and preferences, to predict their likelihood of making a purchase at different price points. By doing so, machine learning models can help businesses optimize their pricing strategy and make informed decisions about the best price for their products.
Moreover, machine learning algorithms can continuously learn and adapt as new data becomes available, which helps ensure that the pricing strategy remains relevant and effective over time.
It is important to note that pricing analytics is just one aspect of a comprehensive pricing strategy, and businesses should also consider other factors such as the cost of production, market trends, and the competitive landscape when determining the optimal price for a product or service.
Improving Lead Generation and Qualification
Predictive analytics can be used to help a sales organization identify qualified leads, meaning those potential customers that have a strong need for the product or service being offered, as well as the budget and authority to make the purchase. By studying the attributes of qualified leads to train machine learning algorithms, a business can forecast which leads are most likely to convert into paying customers.
Machine learning can be used to improve Lead Generation and Qualification by automating and optimizing various tasks in the process. Here are some ways machine learning can help:
Lead Scoring: Machine learning models can analyze large amounts of data about leads, such as their behavior, interests, and demographic information, to assign a score to each lead that reflects their level of interest and likelihood of making a purchase. This helps sales teams prioritize their follow-up efforts and focus on the most promising leads.
Lead Segmentation: Machine learning algorithms can segment leads into different groups based on common characteristics, such as their job title, location, or interests. This allows sales teams to tailor their outreach and messaging to each group, improving the effectiveness of their efforts.
Predictive Lead Qualification: Machine learning models can analyze data about leads, such as their behavior, to make predictions about their likelihood of making a purchase. This can help sales teams focus their efforts on the most promising leads and reduce the time and resources spent on unqualified leads.
Chatbots: Machine learning algorithms can be used to develop chatbots that can engage with leads in real-time and gather information about their needs and interests. This can help qualify leads and improve the efficiency of the lead generation process.
Maximizing Customer Lifetime Value
It is always helpful for a company to identify customers that will bring in the highest revenue over time and then strive to retain those customers. Predictive analytics can be used to study past purchasing patterns and customer retention rates in order to reveal the most valuable customers. The company can then create special deals and discounts only for these clients and reward their loyalty with special privileges and other benefits.
Machine learning can help maximize Customer Lifetime Value by using data to improve customer engagement and satisfaction, predict customer churn, make personalized recommendations, and optimize customer segments. This helps businesses increase sales and retain valuable customers over time.
Minimizing Customer Acquisition Cost
It is important for marketing professionals to understand their organization’s customer acquisition cost (CAC), which is the total cost required to acquire a single customer, including expenses such as marketing, advertising, sales commissions, and any other direct costs associated with acquiring a customer. Businesses can analyze data on these costs and use predictive analysis to predict what gives them the most bank for their marketing buck. By focusing on the efforts that are most likely to result in successful customer acquisitions in the least amount of time, businesses can free up funds to spend elsewhere.
In this blog, we explored many ways that predictive analytics can help marketing professionals identify and retain the best customers, predict which customers are most likely to churn, reduce operational and advertising costs, and to optimize the timing and content of marketing campaigns. By using a data-driven approach, organizations can gain valuable insights into their customers’ behavior and preferences, facilitating highly customized and effective marketing efforts.
April 12th, 2022 by Taymour
The AI topic generates a lot of buzz, but as with any major debate, some claims must be taken with a grain of salt. The fact that AI means different things to different people almost guarantees that some claims are a stretch. Definition aside, AI’s underpinnings are complex and constantly evolving, which means the discipline requires constant interpretational flexibility. Some practitioners, in their own self-interest, will take advantage of this ambiguity by initiating AI projects that might never be realized. Therefore, upright practitioners must call out blatantly false or misleading claims. This paper’s focus is to make the reader aware of an exploitation in a branch of AI called machine learning. Without attempting to define this subdiscipline too strictly, we’ll simply say that machine learning is a way of solving problems with data, using computers.
Actionable Levers
Machine learning does not physically solve problems; rather, it proposes a means to an end. A machine learning project’s outcome is a description or prediction that leads to a recommendation for a person (software, robot, etc.) to perform a certain action. In other words, machine learning itself does not save lives, reduce costs, or generate more revenue. Rather, the decisions based on AI’s recommendations are what make the difference (i.e., the recommendation to prescribe a particular medication cocktail could save lives, or the decision to hire more or fewer people could affect revenue). Machine learning’s outcome, in short, is information, which must have a corresponding lever or action that a person, software, or robot will take to realize its benefits.
AI Claims
A red flag should go up whenever claims of success are directly attributed to machine learning. For instance, a recent presenter at a Nashville analytics conference claimed to have saved millions of dollars for a hospital system using AI. While machine learning did evaluate every imaginable metric to measure hospital productivity, according to the presenter, machine learning itself saved lives and money… not the actions taken based on its recommendations. Because of the nebulous nature of AI and the complexities involved in machine learning, some participants may not have appreciated the missing link between the machine learning analysis results and the necessary actions that had to accompany them.
In the case of the presenter’s example, the hospital nurses’ patient response time ostensibly decreased by over 35% due to machine learning. When asked how this improvement occurred, the presenter claimed that machine learning produced an optimal efficiency metric which nurses incorporated into their daily routines. What the presenter left out, however, were insights into how humans fulfilled machine learning’s recommendations. This omission should have at minimum raised red flags for the listeners.
Furthermore, the presenter claimed that AI transformed a declining hospital chain into one of the world’s most efficient and profitable health care institutions by using machine learning algorithms to analyze collective workflows across multiple failing locations. Missing once again, however, was the “how.” Unfortunately, because of the disconnect between AI insights and human actions, the accuracy of the presenter’s claims about AI’s effectiveness is unclear. If the failing hospitals were in fact converted into efficient and profitable sites, the recovery may have resulted from actions unrelated to the AI analyses. As the number of AI providers proliferate, similar claims, obscured by the ill-defined and evolving AI field, become increasingly common.
Making AI Actionable
While the mathematics and computer science skills needed to create machine learning algorithms are highly complex, applying the algorithms industrially is far less involved (especially with pre-trained machine learning procedures). The difficulty lies in solving for the right outcomes and connecting those outcomes with the right levers. An analytic plan involves not only using machine learning to crunch data, but also evaluating how an entity can incorporate the machine learning models’ recommendations into its employees’ daily workflows, interconnected processes, and culture.
To illustrate, consider the nursing example from above. Let’s assume that a machine learning model did indeed optimize the time nurses take to perform major tasks in order to help them utilize their respective schedules more efficiently. Moreover, machine learning suggests that the length of time nurses should take to respond to a patient is X, a 35% decline from the pre-optimized state. That alone is fantastic, but it doesn’t account for the nurse’s choices and the consequences of those choices. To respond to patients more quickly, nurses might decrease the time it takes to perform other tasks or even eliminate some tasks altogether. If time allocations were what was being solved for (the presenter did not define the target or outcome variable), and the new time-allocation recommendations could realistically be implemented, they would have to work in conjunction with other machine learning recommendations that humans would also need to adopt.
With over three decades of advanced analytics experience in Fortune and media companies, I have learned that it’s excruciatingly difficult for people to implement more than two or three major changes to their job specifications at one time. The troubling part of the hospital AI presentation was that the actionable complexity associated with any machine learning project was not discussed. Questions that begged more explanation of how the machine learning results were actually used remained unanswered, hidden in a safe cloud of AI ambiguity. If a machine learning project’s final resting place is in a presentation, versus application in a hospital, manufacturing assembly line, retail store, or software delivery system, it becomes totally self-serving. Fortunately, examples abound of machine learning recommendations that result in actionable outcomes. However, unless a clear explanation is forthcoming about what actions are required (or were taken) to make machine learning actionable, you should maintain a sense of caution when interacting with individuals’ claims about AI’s seemingly mystical powers.
Some researchers have argued that AI is overhyped, while others believe its potential is being underestimated. Regardless, many AI claims don’t stand up to scrutiny. Another issue is that people who work with AI often make bold claims that the general public cannot understand or verify. Machine learning application is difficult; it can’t be done on a whim. If you’re looking to use machine learning in your business, do plenty of research and find a trustworthy team to help you out. Be careful when interacting with companies that promise the world with their AI-powered products; implementing these projects takes more than just flipping a switch.
April 12th, 2022 by Taymour
Just when you thought you had machine learning (ML) figured out, you find a new type waiting to be discovered. If you’re a marketer or data scientist, staying up-to-date on the different types of machine learning and how they can be used to improve your campaigns and analytics is important. In this blog post, we’ll explore the three main types of machine learning:
- Supervised learning
- Semi-supervised learning
- Unsupervised learning
We’ll also discuss some of the applications for each type of machine learning. So, what are these different types of machine learning? Let’s find out!
Supervised Learning
Supervised learning is when the training data has both the input and output. For example, the training set would include images with a goat and images without a goat, and each image would have features of a goat or something that is not a goat. In this way, you supervise the machine’s learning with both the input (e.g., explicitly telling the computer a goat’s specific attributes: arched back, size and position of head and ears, size and relative location of legs, presence and shape of backward-arching horns, size and presence of a tail, straightness and length of hair, etc.) and the output (“goat” or “not goat” labels), so the machine can learn to recognize a goat’s characteristics. In other words, you’re getting the computer to learn a classification system you’ve created. Classification algorithms can sort email into folders (including a spam folder).

Most regression algorithms are so named for their continuous outputs, which can vary within a range, such as temperature, length, blood pressure, body weight, profit, price, revenue, and so on. The above sales model example would rely on a regression algorithm because revenue—the outcome of interest—is a continuous variable.
Semi-Supervised Learning
Semi-supervised learning occurs when the training data input is incomplete, meaning some portion of it does not have any labels. This approach can be an important check on data bias when humans label it, since the algorithms will also learn from unlabeled data. Gargantuan tasks like web page classification, genetic sequencing, and speech recognition are all tasks that can benefit greatly with a semi-supervised approach to learning.
Unsupervised Learning
Unsupervised learning happens when the training data input contains no output labels at all (most “big data” often lacks output labels), which means you want the machine to learn how to do something without telling it specifically how to do so. This method is useful for identifying data patterns and structures that might otherwise escape human detection. Identified groupings, clusters, and data point categories can result in “ah-ha” insights. In the goat example, the algorithm would evaluate different animal groups and label goats and other animals on its own. Unlike in supervised learning, no mention is made of a goat’s specific characteristics. This is an example of feature learning, which automatically discovers the representations needed for feature detection or classification from raw data, thereby allowing the machine to both learn the features and then use them to perform a specific task.
Another example of unsupervised learning is dimensionality reduction, which lessens the number of random variables under consideration in a dataset by identifying a group of principal variables. For reasons beyond the scope of this paper, sparsity is always an objective in model building for both parametric and non-parametric models.
Unsupervised machine learning algorithms have made their way into business problem-solving and have proven especially useful in digital marketing, ad tech, and exploring customer information. Software platforms and apps that make use of unsupervised learning include Lotame (real-time data management) and Salesforce (customer relationship management software).
Other Machine Learning Taxonomies
Supervised, semi-supervised, and unsupervised learning are three rather broad ways of classifying different kinds of machine learning. Other ways to provide a taxonomy of machine learning types are out there, but agreement on the best way to classify them is not widespread. For this reason, many other kinds of machine learning exist, a small sampling of which are briefly described below:
-
Reinforcement Learning
The algorithm receives positive and negative feedback from a dynamic environment as it performs actions. The observations provide guidance to the algorithm. This kind of learning is vital to autonomous cars or to machines playing games against human opponents. It is also what most people probably have in mind when they think of AI. “Reinforced ML uses the technique called exploration/ exploitation. The mechanics are simple—the action takes place, the consequences are observed, and the next action considers the results and errors of the first action.”
-
Meta Learning
Meta machine learning is where the algorithm gets smarter with each experience. With every new piece of data, the algorithms creates its own set of rules and predictions based on what it has learned before. The algorithm can keep improving by trying different ways to learn- including testing itself.
-
Transduction Learning
Transduction in supervised learning is the process of predictions being made on new outputs, based off both training inputs/outputs as well as newly introduced inputs. Unlike inductive models which go from general rules to observed training cases, transduction instead goes from specific observed training cases to even more specific test cases. This usually incorporates Convolutional Neural Networks (CNNs), Deep Belief Networks (DBN), Deep Boltzman Machine (DBM), or Stacked Auto Coders. Transduction is powerful as it can be used for both supervised and unsupervised learning tasks.
There are many transductive machine learning algorithms available, each with its own strengths and weaknesses. Some of the more popular ones include support vector machines (SVMs), decision trees, and k-nearest neighbors (k-NN). SVMs have been particularly successful in applications such as text classification, image classification, and protein function prediction. Decision trees tend to work well when the data is highly structured (such as financial data). K-NN is another algorithm that is commonly used in transductive settings.for transductive machine learning, as it is relatively simple to implement and can be used for both regression and classification tasks.
-
Deep Learning
Deep learning is a subset of machine learning that deals with algorithms inspired by the structure and function of the brain. Deep learning is part of a broader family of machine learning methods based on artificial neural networks with representation learning. It uses networks such as deep neural networks, deep belief networks, and recurrent neural networks. These have been applied to a variety of fields like computer vision, machine hearing, bioinformatics drug design natural language processing speech recognition and robotics.
The deep learning algorithm has been shown to outperform other methods in many tasks. However, deep learning is also a complex field, and requires significant expertise to design and train effective models. In addition, deep learning algorithms are often resource intensive, requiring large amounts of data and computational power. As a result, deep learning is typically used in combination with other machine learning methods, such as shallow neural networks or support vector machines.
-
Robot Learning
Algorithms create their own “curricula,” or learning experience sequences, to acquire new skills through self-guided exploration and/or interacting with humans.
One such algorithm, known as Q-learning, is often used in reinforcement learning. Q-learning involves an agent that interacts with its environment by taking actions and receiving rewards or punishments in return. The goal of the agent is to learn a policy that will allow it to maximize its reward.
Q-learning can be used to teach a robot how to perform a task such as opening a door. The robot would first need to be able to identify the door and then figure out how to open it. In order to do this, the robot would need to trial and error different actions until it found the one that worked best.
Once the robot has learned how to open the door, it could then be taught how to close it. This could be done by rewarding the robot for taking the correct action and punishing it for taking the wrong action.
Through Q-learning, robots can learn a wide variety of skills. This type of learning is becoming increasingly important as robots are being used in more complex tasks such as search and rescue, manufacturing, and healthcare.
-
Ensemble Learning
This approach combines multiple models to improve predictive capabilities compared to using a single model. “Ensemble methods are meta-algorithms that combine several machine learning techniques into one predictive model in order to decrease variance (bagging), decrease bias (boosting), or improve predictions (stacking).”
This approach is often used in data science competitions, where the goal is to achieve the highest accuracy possible. Ensemble machine learning has been used to win many well-known competitions, such as the Netflix Prize and the KDD Cup.
While ensemble machine learning can be very effective, it is important to remember that it comes with some trade-offs. This approach can be more complex and time-consuming than using a single model. In addition, the results of ensemble machine learning can be difficult to interpret.
Today’s powerful computer processing and colossal data storage capabilities enable ML algorithms to charge through data using brute force. At a micro-level, the evaluation typically consists of answering a “yes” or “no” question. Most ML algorithms employ a gradient descent approach (please see a related post Neural Networks (NN Models) as an example of supervised learning .known as back propagation. To do this efficiently, they follow a sequential iteration process.
In lieu of multivariate differential calculus, an analogy may help the reader better understand this class of algorithms. Let’s say a car traverses through a figurative mountain range with peaks and valleys (loss function). The algorithm helps the car navigate through different locations (parameters) to find the mountain range’s lowest point by finding the path with the steepest descent. To overcome the problem of the car getting stuck in a valley (local minimum) that is not the lowest valley (global minimum), the algorithm sends multiple cars, each with the same mission, to different locations. After every turn, the algorithm learns whether the cars’ pathways help or hinder the overarching goal of getting to the lowest point.
More technically, the gradient descent algorithm’s goal is to minimize the loss function. To improve the prediction’s accuracy, the parameters are hyper-tuned, a process in which different model families are used to find a more efficient path to the global minimum. Sticking with the mountain range analogy, an alternative route may fit the mountain topology better than others, thereby enabling a car to find the lowest point faster. Most of these ML models make relatively few assumptions about the data (e.g., continuity and differentiability are assumed for gradient descent algorithms) or virtually no assumptions (e.g., most clustering algorithms, such as K-means or random forests); the essential characteristic that makes it “machine learning” is the consecutive processing of data using trial and error. Stochastic (can be analyzed statistically) models make assumptions about how the data is distributed: “I’ve seen that mountain range before, and I don’t need to send a whole fleet of cars to accomplish the mission.” Related blog post: Statistical Modeling vs. Machine Learning
How iteration can lead to more precise predictions than stochastic methods should make sense to you: The exact routes are calculated rather than estimated with statistics. However, because the loss (a.k.a. cost) function will usually be applied to a slightly different mountain range, the statistical models, which are more generalizable, may ultimately lead to a superior prediction (or interpolation). However, while statistics and non-parametric ML are clearly different, non-parametric ML algorithms’ iterative elements may be used in a statistical model, and conversely, non-parametric ML algorithms may contain stochastic elements.
A fuller understanding of the differences between these machine learning variations and their highly-specific, continuously-evolving algorithms requires a level of technical knowledge beyond the scope of this paper. A more fruitful avenue of inquiry here is to explore the relationship of ML and statistics as they relate to AI.
February 24th, 2022 by Taymour
Data is the lifeblood of business today. It’s what we use to make informed decisions about where to allocate our resources, how to improve our products and services, and who our target market is. Of course, relevant data must exist and be of satisfactory quality to add value, and it mustn’t get into the wrong hands for security and privacy reasons. Data must also be sufficient for building machine learning models. When data doesn’t meet these criteria, synthetic data can be helpful. Synthetic data generation can be faster, more adaptable, and more scalable than real-world data. It may also be easier and less expensive to acquire. Synthetic data can be incredibly beneficial for businesses in several ways, which we’ll explore in this blog post.
Data Acquisition: Cost and Speed
The major cost of synthetic data is the upfront development phase. After that, generating data becomes increasingly more cost-effective than collecting real information. Fake data is often seen as being easier and less expensive to acquire compared to real data for a number of reasons.
- First, in many cases it can be generated automatically, without the need for manual labor.
- Second, it is often not subject to the same legal restrictions as real data. For example, it can be much easier to generate synthetic cornea images than it is to collect real ones, due to all the regulations around collecting biometric data.
- Third, synthetic data can be generated in controlled environments, which makes it much easier to ensure that the data is of high quality.
- Finally, synthetic data can be generated at scale more easily than real data, making it more cost-effective in many cases.
Use Case 1: Anonymizing Data for Privacy and Security Purposes
One of the key challenges in healthcare and financial services is protecting patient and customer privacy while still being able to use data for research and analytics. A common approach to this problem is anonymization, or de-identifying data by removing personal information like names and addresses. However, this approach can often lead to data that is too abstract to be useful. Synthetic data offers a potential solution to this problem, as it’s generated by algorithms that mimic real data’s statistical properties, but without any actual personal information. It can therefore be used for research and analytics without compromising privacy. In addition, synthetic data can be generated specifically for a particular application, making it more useful than anonymized data. As privacy concerns continue to grow, synthetic data may play an increasingly important role in health care and financial services.
Both anonymization and de-identification involve removing personal identifiers from data, but the two approaches have some important differences. Anonymization is the process of irreversibly transforming data so it can no longer be linked back to an individual, which means once data has been anonymized, it can never be used to identify an individual, even if the anonymization process is reversed. De-identification, on the other hand, is a process of removing personal identifiers from data while still retaining the ability to link the data back to an individual. Therefore, de-identified data can be used for research or statistical purposes, as long as the individuals involved can never be re-identified. While both anonymization and de-identification serve the same basic purpose, choosing the right approach based on a given situation’s specific needs is important.
The Health Insurance Portability and Accountability Act (HIPAA) is a US federal law that establishes standards for handling protected health information (PHI). PHI is any information related to an individual’s health, including medical records, insurance information, and other personal health data. HIPAA requires that covered entities take steps to protect PHI’s confidentiality, and it imposes strict penalties for unauthorized disclosures. De-identified data is not subject to these restrictions, so it can be freely shared without concern for violating HIPAA. However, it’s important to note that de-identified data is still considered PHI if it can be used to identify an individual. For this reason, organizations should take care to ensure that de-identified data is properly anonymized before sharing it.
Another consideration is that the world has become a global village, which makes data- sharing easier than ever before. However, due to PHI’s sensitive nature, it cannot be sent overseas without compromising patient confidentiality. Synthetic data with anonymized information, on the other hand, can be analyzed overseas without violating HIPPA. That way, patients’ privacy is protected, but important research can still be conducted.
Use Case 2: Developing and Testing Software
Synthetic data is often used to develop and test software because it can be generated to account for all scenarios, including those that may be rare (or even impossible) in real life. Algorithms that mimic real-world conditions can generate this data, or developers can create it manually. In either case, synthetic data can be an invaluable tool for testing software to ensure it works correctly in all situations.
In some cases, no real-world data exists that would be relevant to testing the software, so synthetic data is the only option. In other cases, the amount of data required to thoroughly test the software is prohibitively expensive or time-consuming to collect. In either case, using synthetic data can help ensure that the software is of high quality and will work correctly when it is finally released, which allows software developers to test their products in a controlled environment, without having to rely on potentially unavailable or incomplete real-world data. In some cases, synthetic data can be more effective than real-world data, as it can be specifically designed to cover all the potential scenarios the software might encounter. This ability makes it an essential tool for developing and testing software.
Use Case 3: Simulating Real World Events
In recent years, the focus on using synthetic data to create realistic simulations has increased, due to the fact that synthetic data can more accurately represent real-world conditions than traditional methods. For example, when creating a car-accident simulation, synthetic data can create a more realistic representation of the physics involved. In addition, synthetic data can create simulations that are not possible with real-world data. By manipulating the properties of synthetic data, for instance, it’s possible to simulate a black hole. As synthetic data use becomes more widespread, increasingly more simulations will likely be created that would not be possible without it.
For example, synthetic data and autonomous vehicles are a natural fit for each other, owing to the difficulties and significance of “edge cases” in the world of AVs. Collecting real-world driving data for every conceivable scenario that an automated vehicle may encounter on the road just isn’t feasible. Given how unpredictable and ill-defined the world is, it would take hundreds of years of real-world driving to gather all the information necessary to create a genuinely safe autonomous vehicle. To remedy this situation, AV companies created sophisticated simulation engines that generate the required data volume to train their AI systems thoroughly. This technology allows us to generate thousands—or even millions—of different driving scenario permutations such as changing other cars’ positions on the road, adding or removing pedestrians, increasing or decreasing vehicle speeds, adjusting the weather conditions, and so forth.
Use Case 4: Balancing Machine Learning Models
In machine learning, data is the foundation on which models are built and trained. Without enough high-quality data, producing accurate predictions can be difficult, especially for imbalanced datasets that contain a disproportionate amount of examples from one class (e.g., positive or negative sentiment). In these cases, data augmentation—the process of artificially generating new examples—can be used to balance the dataset and improve the model’s performance.
Synthetic data can be used to balance machine learning models in a number of ways. For example, if a dataset is skewed toward a particular class (e.g., it has more data points for males than females), synthetic data can be generated to even out the class distribution. This technique ensures that the model is trained on a more balanced dataset, and thus is less likely to overfit to the majority class.
Additionally, synthetic data can be used to augment existing datasets, which is particularly useful when limited real-world data is available. However, it’s important to train a high-quality model. By generating additional synthetic data points, the model can be trained on a larger, more representative dataset.
Finally, synthetic data can be used to create entirely new data, which is useful when real-world data isn’t available or is too difficult to collect. For example, synthetic medical records can be generated to train predictive models without violating patient privacy.
Clearly, synthetic data plays an important role in machine learning and can be used in a variety of ways to improve machine learning models’ performance.
Data that is difficult or impossible to collect can also be used with the principle of a dangerous collection. For example, if your AI algorithm needs to find a needle in a haystack, synthetic data can generate rare events so that an AI model can accurately learn from it. This is especially useful in cases where real data may be too expensive or difficult to collect. For example, if you are training an AI model to detect rare disease symptoms, it would be very expensive and time-consuming to collect a large enough dataset of real data. In this case, you can use synthetic data to generate a dataset that is large enough for your AI model to learn from. Another example where synthetic data can be used is when you are training an AI model to recognize objects in images. If you have a dataset of images that do not contain the object you want your AI model to recognize, you can use synthetic data to generate images that do contain the object.Consider this: Some of the most beneficial uses of AI are focused on ‘rare’ events. By its very nature, rare data is hard to collect. Going back to the automotive example, car crashes don’t happen very often, so you rarely have a chance to collect this data. But with synthetic data, you can simulate different crash scenarios and choose how many crashes you want to simulate .
Synthetic data is becoming an increasingly important tool for businesses and researchers. It can be used to anonymize data, develop and test software, balance machine learning models, and simulate real world events. Among synthetic data’s chief benefits are its low cost and fast generation time. For these reasons alone, businesses would be well-advised to consider using synthetic data as a supplement to their real data in order to get the most value from their data sets.
April 12th, 2020 by Taymour
An increasing proportion of businesses use scientific methods to analyze data. Yet, because some key decision-makers don’t believe in data-driven methods, a sizable number of them don’t turn their data into actionable information. Instead, these individuals rely on their instincts to drive decisions. If prioritized over data, this hunch-based mindset leads to inefficiencies and wasted opportunities. In March of 2015, I wrote an article on the prevalence of such decision-making practices in corporate America. More broadly, I discussed how people continue to discredit the data and science that support climatologists’ claims that human actions are the root cause of climate change.
New Data in a New World
Five years later, we find ourselves in a world consumed by a viral pandemic, observing the same phenomenon from a new angle. The novel coronavirus and the insidious illnesses and fatalities the resulting COVID-19 infections cause have given the population (as involuntary participants of a natural history case study) the opportunity to witness the power science has over a non-empirical approach. The latest Quinnipiac University survey found that approximately 80 percent of U.S. adults back a national stay-at-home order, while less than 20 percent oppose the idea. The overwhelming international scientific consensus is that mitigation is worth the consequential economic upheaval. Yet, even with the clear cause-and-effect relationship between data-driven actions and less-destructive outcomes we have realized around the world, science critics still openly take issue with the data, analysis, interpretation, and most importantly, the corresponding safety actions the nation’s top healthcare experts recommend.
Uncertain Times
As we watched the infection spread weeks before it hit us, we viewed the coronavirus pandemic as a public health nightmare no one could have predicted. Or was it? Years before this novel strain surfaced, government strategists warned that a viral pandemic similar to the 1918 Spanish flu was inevitable. At the time of this writing, more than 3.5 million cases have been confirmed, and over 250,000 deaths have resulted worldwide, with roughly a third of those located within the U.S. Even with those indisputable figures, both the cause of the pandemic and theories about what would happen next were highly emotional topics and a matter of relentless political and social debate.
Data vs. Gut Instinct?
Regarding this pandemic, politics and science are closely intertwined, as they always are whenever stakes are high. We now have the opportunity—and quite frankly, the responsibility—to use a scientific approach to inform political decisions rather than distorting its validity to yield a different outcome. Gut feelings and intuition don’t always have to contravene a data-driven approach; however, when the data reveals an uncomfortable truth, we must be prepared to take actions that are less than ideal. Based on the experts’ consensus, we should also engage in constructive debates on how to prepare for future outbreaks using the lessons learned from this and other occurrences.
The Rise of a Global Pandemic
While the origin of the novel coronavirus’s transmission to humans is controversial, the first reported case came from Wuhan, China, on November 17, 2019. A few weeks later, the viral spread became impossible to contain, and the order to lock down more than 11 million Wuhan residents clearly came too late. The proverbial horse was already out of the barn as COVID spread swiftly across mainland China and then almost instantaneously to most countries across the globe. The world saw a local Chinese outbreak transform into an epidemic, and then in just a matter of weeks, a worldwide pandemic. We obsessively watched news network reports of large and small communities alike succumbing to the stealthy, highly-contagious, indiscriminate, and too-often deadly novel coronavirus.
January 21, 2020 marked the first reported case of coronavirus in the United States. However, we now know that it was more likely introduced weeks prior and circulated via asymptomatic and misdiagnosed propagators. By March, we were experiencing a shrinking supply of hospital beds, ventilators, and hospital staff. We also learned to use a new acronym in casual conversation (“PPE” for “personal protective equipment”) because we understood through simple predictions that we had nowhere near enough of it to protect our hospital and frontline workers, not to mention ourselves. By the end of March, most states were on stay-at-home orders and bracing for thousands of deaths in a matter of weeks.
The First COVID 19 Stay At Home Order
As local government authorities gave orders to stay home, the masses unwittingly sat through a crash course in data analysis. Concepts covered included data sufficiency, randomization in data collection and sampling, weighted results, moving averages, various measurement biases and issues, data outliers, statistical distributions, forecasting, and margins of error. Simulations showed how the insights could be made actionable, as a distribution’s slope, peaks, and tails could be altered to simulate different outcome scenarios approximately two weeks after the order had been put into effect.
COVID Data Put To The Test
Laypeople learned what it means to “flatten the curve” because they had a vested interest to do so. As the ramifications of statistical distributions’ changing shapes were contemplated, many relied on tables and graphs to help project the virus’s propagation and its impact on their local communities and loved ones. As we’ve seen, fear can be a powerful motivator for learning. This contagion, with its pernicious and boundaryless global reach, has fast-tracked the learning curve for the average data-savvy person and “right-brained” among us. My hope—bolstered by favorable reactions to the mitigation efforts—is that it has also converted some traditional science debunkers into believers. The unconvinced argue that the data insights are inaccurate, blown out of proportion, or just downright lies or scams. For most of us, however, the exponential slope’s interpretation was made crystal clear. The thought of COVID-19 cases doubling every three to four days without enough ICU beds, doctors, ventilators, test kits, and PPE was scary and easy enough to comprehend: Our lives were at risk.
Data and the Layperson
Not only did people want to understand the disease’s spread, recovery, and death rates, but they were also motivated to find its causes and what they could do to mitigate its impact. Relevant information about how to “dodge the bullet” when the scourge hit their neck of the woods was a real-world and scalable example of how to make analytical insights actionable. While the predictions themselves were impressive (at least to the geeks among us), action was and always will be what is most important. People recognized that changing the statistical distribution’s shape was, quite literally, a matter of life and death. Simple actions like washing hands and sneezing into an elbow gave way to more socially impactful actions like ceasing to shake hands or gather at bars, beaches, and restaurants. Eventually, COVID-19 testing began in earnest, and most of us were asked and then told to stay home. Businesses deemed “non-essential” shut down within weeks of the first confirmed case in the U.S.
Data Skeptics Dig In Their Heels
Because of the devastating impact this unprecedented shutdown had on the economy in the weeks that followed, many began to question whether mitigation and suppression measures “made the cure worse than the disease.” A sales executive I know distrusted the reported figures: “Wouldn’t the death rate be lower if the denominator was deflated due to inadequate testing?” Any respectable analyst would consider this question; however, I didn’t expect him to ask it because hunches, not data, usually drive the sales industry. To me, this query was another sign that analytical principles were infiltrating society at a much deeper level than before the pandemic.
He was correct, by the way. We don’t know precisely how many people have or have recovered from COVID-19 because the U.S. was extremely slow to begin and then ramp up testing. An inaccurate denominator distorts the key metrics used to measure the threat: the number of confirmed cases, those who recovered, and those who died from COVID-19 infections or related complications. Even so, the data we have is the best available to us, and we don’t have enough reason to discredit the insights we could glean from it.
Experts and Politicians Use Data to Educate the Public
Epidemiologists’, virologists’, and other healthcare professionals’ projections delivered the answers we so desperately sought. Some politicians not only used their data and scientific projections to issue drastic measures in an effort to “flatten the curve,” but they also used them to educate the public on how to interpret the various metrics and charts. Their purpose was not only to inform, but also to justify and prepare the government’s future actions.
Governor Andrew Cuomo of New York, for example, used data supplied by Johns Hopkins University and other sources to teach daily statistics courses. Although these daily briefings were intended for New York citizens, people throughout the U.S. and even worldwide eagerly watched them. Cuomo’s approach was simple, measured, and consistent—qualities data scientists should attempt to emulate. He warned New Yorkers (and many of us watching from elsewhere) of the horrible consequences that lay ahead and continued calmly to interpret the information as projections solidified into new realities unfolding before our eyes. The mortality rates increased proportionally to the exponential rate of newly-confirmed COVID-19 cases. Dr. Anthony Fauci, director of the National Institute of Allergy and Infectious Diseases, shared similar projections during his daily briefings with President Trump at the White House.
The Data Skeptics Are Not Convinced
However, some of the evidence was not sufficient for the science skeptics, whether their doubts were politically motivated or not. For example, some constituents refused to believe the data’s veracity, claiming that unrelated medical conditions artificially inflated the U.S.’s COVID-19 death toll. While questioning data and the science behind analysis and predictions is always reasonable, the slope becomes slippery when one rejects the data based on non-scientific motives. Given the pandemic’s scale, it’s no surprise that conspiracy theories abound. According to Dr. Fauci, “I think it falls under the category of something that’s very unfortunate—these conspiracy theories that we hear about. Any time we have a crisis of any sort there is always this popping up of conspiracy theories.” For your entertainment, you may want to Google “Cornell University’s Alliance for Science COVID: Top 10 current conspiracy theories.”
Using Data to Justify Stay at Home Order
Nearly every state in the union eventually issued “stay at home” orders, as did most of the world. This action clearly curbed the spread of the virus and saved millions of lives. However, some of the same people who ignored the impact social distancing had on saving lives, may also be discounting the possible emergence of a new and more pernicious viral strain in the future that could wreak an even greater toll on the economy. Without a doubt, economic ramifications of this caliber haven’t been seen since the Great Depression.
At present, we sit at a crossroads between what the data tells us and our desire to “get back to normal” (whatever “normal” looks like) in the future. Many resent being confined to their homes. They want to return to work, shop, enjoy entertainment, and socialize with their friends, which is understandable. Unemployment can be debilitating or even socially humiliating. Additionally, the sudden global economic shutdown’s other consequences are becoming obvious. For instance, it has caused and will continue to cause major supply chain disruptions, food shortages, and hunger, as well as significant increases in domestic violence and deaths related to substance abuse and suicide. Many other such “butterfly effects” are also related to the novel coronavirus.
Federal guidelines recommended states wait to begin a phased reopening until they could document 14 consecutive days of declining cases. Governors in most states simply ignored the data (or interpreted it in a way one might expect from a politician) and began to loosen state restrictions even as their confirmed case numbers and deaths continued to rise. In the few states where restrictions remained in place, people took to the streets—some armed with assault-style weapons—to protest the stay-home order and aggressively complain that it was unconstitutional.
The restriction’s economic impact on people’s livelihood cannot be minimized, so their frustration with the politicians who bar commerce is understandable. However, baseless science and data repudiations should never be acceptable. Still, the blatant dismissal of facts is to be expected, even if some justifications are not. For example, as reported on NBC’s Today Show on April 29, 2020, a protester was simultaneously parading two signs: “END THE SHUTDOWN NOW!” and “Data Over Dictators!” My question for the protester: Do you have alternative data that isn’t driven by politics? Great. Please show us!
As I mention in my 2015 article, “By its very nature, science is based on debunking science with better science.” Unfortunately, alternative data sources that refute the admittedly less-than-perfect coronavirus data from the World Health Organization (WHO), Johns Hopkins University, and other reputable institutions have either not been shared for evaluation, or more likely, simply do not exist.
On the same Today Show episode, co-host Savannah Guthrie asked California governor Gavin Newsom, “Do you feel in your gut that the worst is behind you in California?” Governor Newsom responded, “I love the way you asked that question… ‘in my gut’… I’m not sure if I’m driven by gut in this respect; I’m driven by data.” A few days later, on May 3, 2020, Governor Cuomo warned in his daily briefing (where data analysis is always a central theme), “Go back to your old behavior, and the numbers are going to go up.” He added, “It is fine to use your gut as long as it is an educated gut.” He implored his constituents to rely on insights derived from the best publicly-available data, claiming, “In New York, we follow the facts, data, and science to make our decisions.” Like these governors, we should follow science-backed directives, not dictators, especially as we face increasing uncertainties.
Long-Term Impact Unknown
At the time of this writing, it’s too early to know the impact of reopening too soon. According to public health officials, relaxing our guard before a vaccine becomes available will probably result in a new and possibly larger outbreak in the future. On the other hand, since testing has been limited, we still don’t know how prevalent the novel coronavirus exposure has been, nor our corresponding antibody response. The hope is that eventually enough people will develop antibodies to create a desired “herd effect” that will ward off future outbreaks. As we prepare for the outbreak’s second and third waves, we must carefully analyze and objectively debate such scientifically-grounded factors.
No One-Size Fits All Here
The best answer for society may be the one that does the best job of simultaneously minimizing both the human and the economic impact of an impending new outbreak. In the long-term, these seemingly opposing forces may not even be at odds with one another. Regardless, we have no alternative but to rely on the best data available as well as scientific principles that are both inclusive and multidisciplinary. Government officials must be transparent and should not censor government institutions like the Centers for Disease Control and Prevention (CDC) or the National Institutes for Health (NIH). We can find ways to slowly, carefully, and responsibly reopen, taking into consideration our “new normal;” it must be an orchestrated balancing act.
As they were during the 1918 Spanish Flu pandemic (which shares eerily similar aspects with our current global scene, changes to our lives will be inconvenient and uncomfortable. But if we let it, science can help us make decisions wisely to minimize suffering. Multiple vaccine trials are underway, and agencies are hopeful that an inoculation will be available to the public by early 2021. Until then, it is encouraging to see the many creative ways people are finding to safely begin emerging back into the world, from drive-through veterinary clinics to meeting friends around the world on Zoom. After all, we must get back to living our lives. As I recently overheard a friend say, “I’m all about the science … but I just want to get my hair colored!”
- Countries that have not reported any case of coronavirus: Kiribati, Lesotho, Marshall Islands, Micronesia, Nauru, North Korea, Palau, Samoa, Solomon Islands, Tonga, Turkmenistan, Tuvalu, Vanuatu
- CDC barred from using the phrases ‘evidence-based,’ and ‘science-based’ in reports. President Trump rejects CDC’s 17-page draft recommendation for reopening the United States.
April 12th, 2019 by Taymour
Business and scientific communities have learned to successfully use both machine learning and statistics for predictive analysis, yet machine learning has increasingly become the preferred method. Before looking at why, it is important to understand how these methods differ. In recent years, it has become increasingly apparent that data scientists tend to favor machine learning over statistics. The prevailing view is that their purposes are different: statistics makes inferences whereas machine learning makes predictions. This difference is evident in the Latin roots of each word. In Latin, prediction derives from praedicere “to make known beforehand” and inference stems from inferentem or “to bring into; conclude, deduce.” A statistical inference is how two or more variables are related. In other words, its purpose is descriptive in that it quantitatively explains some type of a relationship. Machine learning primarily focuses on prediction. Yet, a quantitively defined description is often used, successfully, to make predictions.
To make a head-to-head comparison between machine learning and statistics, it is essential to keep this common purpose in mind. This article highlights some of the distinctions on how predictions are made, employed, and interpreted. It also provides examples of why machine learning is gaining favor in business and scientific applications.
New Technology Put Statistics on the Map
The rise of statistical thinking is a result of the numerous new technologies in the first decade of the 1900s. As desk calculators replaced the early tabulation machinery at the beginning of the twentieth century, more complex calculations like Ordinary Least Squares (OLS) equations could be solved. Throughout the century, statistical thinking based on the mathematics of drawing projectable inferences from a smaller sample continued and expanded rapidly. In turn, improved technology made it possible to process increasingly larger volumes of data faster.
Fast forward a century, modern-day data storage and blazingly fast CPUs / GPUs can process massive amounts of data using statistical methodologies. However, while such horsepower can process samples that approach the population (n->N), the fundamental small-to-large deductive principles that underly statistics remain unchanged from earlier days. While the predictive power of statistics has improved with access to more data and processing power, its predictions do not incorporate data it has not previously encountered; it must rely on how well the sample fits a hypothetical, unknown population. The model’s “fit” is manifested by its “parameter estimates,” which are literally guesses of what the predictive data set is expected to look like. In other words, while the model estimates the parameter of a hypothetical and unknown population, we are assuming that the data set used in the prediction literally refers to this theoretically unknown population.
In contrast, machine learning doesn’t require any assumptions. Starting with a training data set, machine learning then applies the patterns it learned to a predictive data set. Unlike the statistical approach, machine learning refines its prediction by learning from the new data. The more data, the merrier!
Whether one approach results in superior prediction depends largely on the scenario at hand. Understandably, either approach can go awry. In the case of statistics, the sample data may not be representative of the population to be predicted. Similarly, a machine learning training data set may not resemble the predictive data set. In these scenarios, the respective results are inadequate predictions. In the world of big data, however, machine learning generally maintains an advantage in the overall predictive accuracy and precision as it can process more information and deal with greater complexity.
So, What Are the Differences in How Predictions Are Made?
Statistics makes predictions (really inferences used for predictive purposes) about the large from the small. Machine learning, on the other hand, makes predictions about the large from the large. It is important to note that both types of predictions can be delivered at the individual or population levels. Statistics draws inferences from a sample using probability theory. Machine learning uses mathematics as a “brute force” means to make its predictions. As some may expect, because machine learning processes more data iteratively, it tends to be far more computationally demanding than statistics. But this limitation is increasingly diminishing in tandem with the recent explosion of processing power and increased storage capacity.
On the surface, both machine learning and statistics are numerically based. This begs the question: what is the difference between mathematics and statistics? While statistical methods may employ mathematics, their conclusions employ non-mathematical concepts. Because statistics is grounded in probability, uncertainty is rooted in its conclusions versus mathematics, which is precise and axiomatic. Statistics is empirically based deductive logic; mathematics uses formal, inductive logic.
Compared to statistically based prediction methods, machine learning does not make any assumptions about the data. Statistics requires assumptions to be satisfied about the sample distribution, which are not always possible or easy to satisfy. In addition, in statistical analysis, the sample data must be clean and pristine for its estimates to be accurate and precise. Machine learning is less fussy. It can utilize structured, unstructured, or even messy data. While there may be inaccurate or “noisy” data that slips into the machine learning process, the use of larger data sets has the potential to reveal patterns that may otherwise have been lost. A larger data pool generally improves the overall predictive power of the machine learning model.
Interpretability
Statistics is typically more interpretable (answers what and some why questions) than machine learning (answers primarily what questions). For example, a regression model in statistics can give insights into why certain variables are included, such as whether headaches are normally associated with the flu. Statistics tries to prove that headaches are a flu symptom by testing this hypothesis on other flu data sets. Machine learning can plow through large amounts of data to uncover correlations between the flu and other features that happen to be correlated with it in the training data set. In this example, machine learning may confirm headaches as a common symptom of the flu but may also uncover other correlations, such as the lack of sunlight exposure or something less obvious like the per capita mass transit usage. Here, the mass transit usage is not a symptom of the flu but could be a factor that helps explain the flu incidence in a certain region during the winter season. Or, as is often the case with machine learning, it may find a feature that is seemingly unrelated but nevertheless helps its prediction.
On the flip side, statistics can delve deeper into the why questions using marginal and conditional probability distributions, which is currently not possible with machine learning. However, machine learning’s raw predictive power may be valued more than the ability to delve deeper into a subject because correlations can also lead to actionable strategies.
Machine Learning Takes Center Stage
In practice, both statistics and machine learning are used today, and both continue to evolve. However, Google searches for these terms show that machine learning began surpassing statistical analysis in popularity in early 2011 (see Figure 1).
Statistical Analysis vs. Machine Learning (blue)
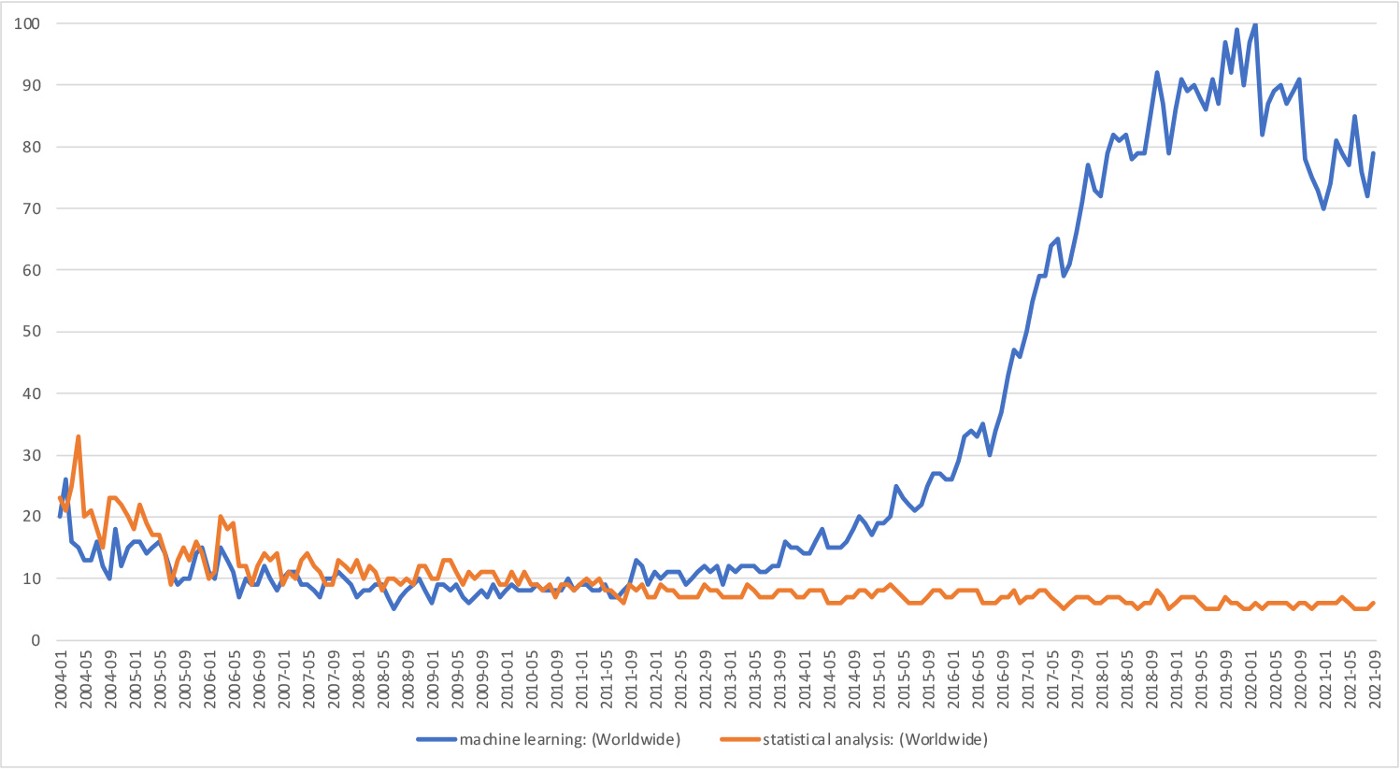
.Google Trends Index Jan 2004-Sept 2021
Faster and cheaper technology can harness the proliferation of data for both greater profits and for social improvements. Though both statistical modeling and machine learning benefit from these advances, machine learning takes greater advantage because it can process all the data it can get its hands on. The prediction gap is expected to widen as technology continues to improve.
To gain further perspective on why machine learning has started to overtake statistically based methodologies, we asked a data science practitioner to explain how they are using machine learning to solve some of the world’s most challenging problems.
Machine learning and other artificial intelligence techniques allow for proactive rather than reactive decision-making. Related: see blog on neural networks (nn models).
APPENDIX
Differences in Vernacular*
March 12th, 2019 by Taymour
May 2023 Update
Since the original article was written in 2017, there have been several significant updates in the field of machine learning and statistics. One important development is the increasing use of deep learning, a subfield of machine learning that uses artificial neural networks to model complex data relationships. Deep learning has enabled breakthroughs in fields such as computer vision, natural language processing, and speech recognition, and has opened up new applications in areas like autonomous driving and personalized medicine.
Another trend has been the growing emphasis on interpretability and fairness in machine learning models. As machine learning is used in high-stakes applications like healthcare and criminal justice, there is a growing need to understand how decisions are being made and to ensure that they are not biased against certain groups. To address this, researchers have developed new techniques for visualizing and explaining the inner workings of machine learning models, as well as methods for auditing them for fairness and bias.
In addition, there has been a growing interest in combining machine learning and statistics in what is sometimes called “statistical learning.” This approach seeks to combine the strengths of both fields, using statistical models to make predictions and machine learning techniques to improve their accuracy and scalability. Some researchers have also explored ways to incorporate uncertainty into machine learning models, drawing on probabilistic modeling techniques from statistics to better handle situations where the data is noisy or incomplete.
Overall, the use of machine learning and statistics continues to grow and evolve, with new applications and techniques emerging all the time. As the amount of data being generated continues to increase, and as the need for accurate and interpretable predictions becomes more urgent, it seems likely that both fields will continue to play important roles in the future of data analysis.
Both business and scientific communities have learned to successfully use machine learning and statistics to provide predictive analysis, yet machine learning has increasingly become the preferred analyzation method. Before looking at why, it’s important to understand the difference between machine learning and statistics. To distinguish between the two, it helps to understand why businesses and scientific communities favor machine learning over statistics. The prevailing view is that their purposes are different: Statistics makes inferences, whereas machine learning makes predictions. This difference is evident in each word’s Latin roots. In Latin, prediction derives from praedicere, which means “to make known beforehand” and inference stems from inferentem, or “to bring into; conclude, deduce.” A statistical inference deals with how two or more variables are related. In other words, its purpose is descriptive, in that it quantitatively explains some type of a relationship. Machine learning, on the other hand, is primarily focused on prediction.
However, a quantitatively-defined description is often successfully used to make predictions. To make a head-to-head comparison between machine learning and statistics, it is essential to keep this common purpose in mind. We’re seeking to highlight some of the distinctions regarding how predictions are made, employed, and interpreted. This article provides several examples of why machine learning is gaining favor in business and scientific applications.
***Fun fact, the above update was written by Chat GPT***
New Technology Put Statistics on the Map
The rise of statistical thinking is a result of numerous new technologies that appeared on the scene in the first decade of the 1900s. As desk calculators replaced the early tabulation machines at the beginning of the twentieth century, they were able to solve more complex calculations like Ordinary Least Squares (OLS) equations. Throughout the century, statistical thinking based on the mathematics of drawing projectable inferences from a smaller sample continued and expanded rapidly. In turn, improved technology made it possible to process increasingly large volumes of data faster.
Fast forward a century. Modern-day data storage and blazingly fast CPUs/GPUs can process massive amounts of data using statistical methodologies. However, while such horsepower can process samples that approach the population (n N), the fundamental small-to-large deductive principles that underlie statistics remain unchanged from earlier days. While statistics’ predictive capacity has improved with access to more data and processing power, its predictions do not incorporate data it has not previously encountered; it must rely on how well the sample fits a hypothetical, unknown population. The model’s “fit” is manifested by its “parameter estimates,” which are literally guesses of how the predictive dataset is expected to look. In other words, while the model estimates a hypothetical and unknown population’s parameter, we assume the dataset used in the prediction literally refers to this theoretically unknown population. Machine learning, however, doesn’t require any assumptions. Instead, it starts with a training dataset and then applies the patterns it learned to a predictive dataset. Unlike the statistical approach, machine learning refines its prediction by learning from the new data.
Whether this approach results in superior prediction depends largely on the scenario at hand. Understandably, either approach can go awry. In the case of statistics, the sample data may not represent the population to be predicted. Similarly, a machine learning training dataset may not resemble the predictive dataset. In these scenarios, the respective results are inadequate predictions. In the world of big data, however, machine learning generally maintains an advantage in overall predictive accuracy and precision, as it can process more information and deal with greater complexity.
What Are the Differences in How Predictions Are Made?
Statistics makes predictions (really inferences used for predictive purposes) about the large (a lot of data) from the small (sample data).. Machine learning makes predictions about the large from the large. It’s important to note that both types of predictions can be delivered at the individual or population levels. Statistics draws inferences from a sample using probability theory, whereas machine learning uses mathematics as a “brute force” means to make its predictions. As one might expect, because machine learning processes more data iteratively, it tends to be far more computationally demanding than statistics. However, this limitation is increasingly becoming less of an obstacle with the recent explosion of processing power and increased storage capacity.
On the surface, both machine learning and statistics are numerically based, which begs the question: What is the difference between mathematics and statistics? While statistical methods may employ mathematics, their conclusions employ non-mathematical concepts. Because statistics is grounded in probability, uncertainty is rooted in its conclusions, whereas mathematics is precise and axiomatic. Statistics is empirically-based, deductive logic; mathematics uses formal, inductive logic.
Compared to statistically-based prediction methods, machine learning doesn’t make any assumptions about the data. Statistics require sample distribution assumptions to be satisfied, which is not always possible or easy to do. In addition, in statistical analysis, the sample data must be clean and pristine for its estimates to be accurate and precise. Machine learning, on the other hand, is less fussy. It can utilize structured, unstructured, or even messy data. While inaccurate or “noisy” data may slip into the machine learning process, using larger datasets has the potential to reveal patterns that may otherwise have been lost. A larger data pool generally improves the machine learning model’s overall predictive power.
Interpretability
Statistics is typically more interpretable (it answers what and some why questions) than machine learning, which answers primarily what questions. For example, a statistics regression model can give insights into why certain variables are included, such as whether headaches are normally associated with the flu. Statistics tries to prove that headaches are a flu symptom by testing this hypothesis on other flu datasets. Machine learning, however, can plow through large amounts of data to uncover correlations between the flu and other features that happen to be correlated with it in the training dataset. In this example, machine learning may confirm headaches as a common symptom of the flu, but it may also uncover other correlations, such as the lack of sunlight exposure or something less obvious like the per capita mass transit usage. Of course, mass transit usage is not a flu symptom, but it could be a factor that helps explain the flu incidence in a certain region during the winter season. Or, it may find a factor that isn’t open to explanation but nevertheless helps its prediction. Using marginal and conditional probability distributions, statistics can delve deeper into why questions, which is currently not possible with machine learning. However, raw predictive power may be more valuable than the ability to delve deeper into a subject when correlations also lead to actionable strategies.
Machine Learning Takes Center Stage
Both statistics and machine learning are used today, and both continue to evolve. However, Google searches for these terms show that machine learning began surpassing statistical analysis in popularity in early 2011 (see Figure 1).
Statistical Analysis vs. Machine learning January 2004 to May 2021
Faster and cheaper technology can harness data proliferation for both greater profits and social improvements. Though both statistical modeling and machine learning benefit from these advances, machine learning takes greater advantage, as it can utilize all the data it can access. The implication is that the prediction gap will widen as technology continues to improve.
Machine learning and other artificial intelligence techniques allow for proactive rather than reactive decision-making. In healthcare, this approach translates to significant savings through cost avoidance and reduction. Across Decode Health’s use cases, we know that it also saves lives by leading to better decisions and earlier interventions.
A (non-exhaustive) list of differences in vernacular are presented below:
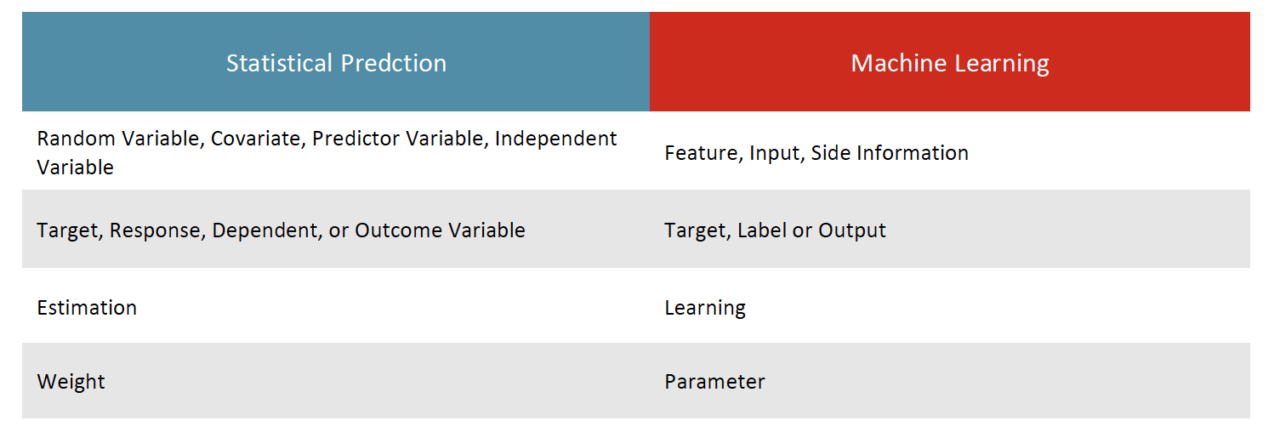
A (non-exhaustive) list of differences in methods are presented below:
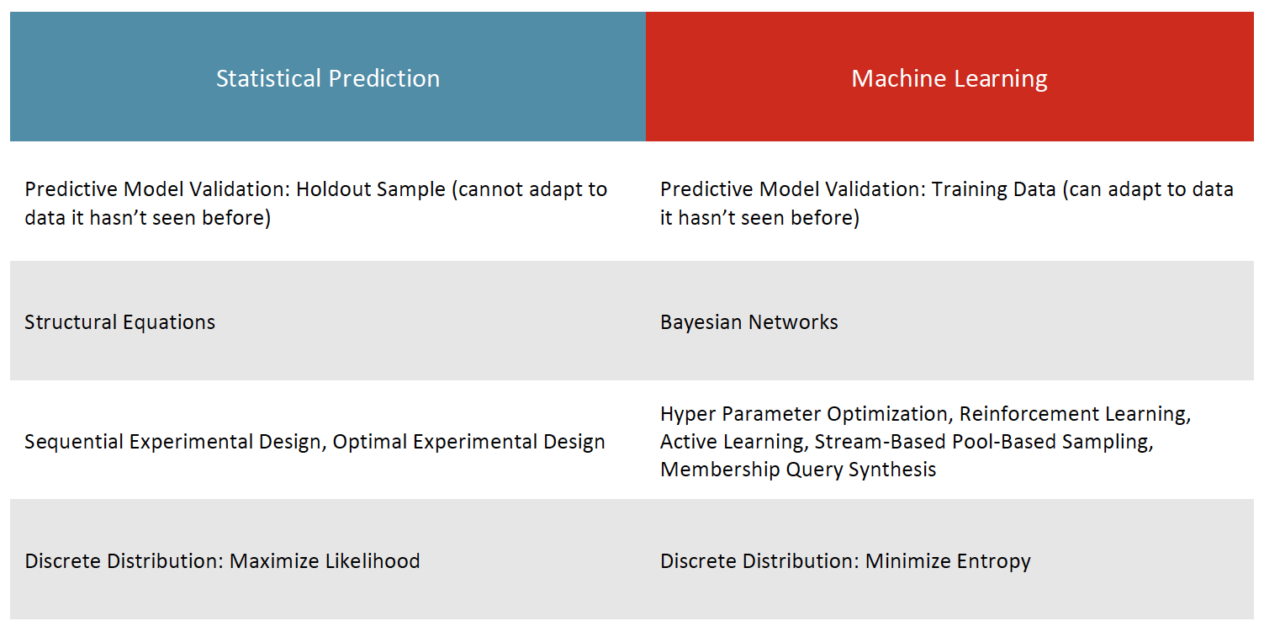
Demystifying the Move to Machine Learning
While it isn’t exactly right to say that machine learning is superior to statistical analysis, several factors have made it more reliable in terms of making predictions. Perhaps the greatest shift drivers are the recent advances in processing power, which make it possible for machine learning to churn larger datasets iteratively, yielding better predictions than statistics. The fact that machine learning models don’t make assumptions about the data means they tend to be more reliable as well.
One of machine learning’s greatest strengths is that it can adapt to data it has not encountered, which means it can make predictions about something new. This outcome isn’t possible with statistical analysis. Additionally, advances in machine learning are making the models more interpretable, a factor that was once one of the statically-based model’s advantages. Since machine learning can handle and exploit an increasing amount of unstructured, “messy” data, it requires less work to prepare for analysis.
Ultimately, machine learning provides a much faster, more accurate way of working with large amounts of data, a feature that’s more in demand with the rise of big data. Sometimes, statistical analysis remains the better option, but machine learning can make predictions with less data cleanup, so businesses can make decisions faster and scientific communities can start understanding the data and its patterns sooner.
March 12th, 2015 by Taymour
The problem inherent in climate change studies is not the amount of data to manage, the technology trying to tame that data, or even the people who use the technology. Science (or more acutely, certain populations’ unwillingness to believe in science) actually poses the greatest challenge to big data. According to the Pew Research Center’s most recent poll, only 40% of Americans believe that global warming is primarily caused by human activities that pump excessive amounts of C02 into the atmosphere. If you belong to this minority, keep reading. If you do not belong to this minority, definitely keep reading.
Science Skepticism
Those who understand the scientific community have a sense of how elusive consensus among scientists can be. By its very nature, science is based on debunking science with better science. Thus, to have an overwhelming majority consensus among the world’s scientists is extremely significant. To be sure, ample room is still left for debate. That debate, however, is more focused on the magnitude of climate change’s impact than its origins.
For this article, I will give corporate America the benefit of the doubt by assuming that it is more scientifically inclined than the population at large (allotting for variations based on industry, geography, and other factors). However, this paper isn’t trying to accurately quantify business’s scientific inclination; instead, it’s about the alarming proportion of science naysayers (both active and passive) who undermine data-driven, actionable insights. Based on my own experiences with a variety of businesses, I estimate that about half the people in corporate America fall into this category.
If I’m correct, then one in every two businesspeople in America disregards data regardless of how reasonable or compelling its conclusions are. These people trust their guts more than any scientific consensus. Sadly, they often dismiss reason and empirically-derived conclusions even before considering any analysis. If they do eventually consider such results, asking them to give the matter any subsequent validation or further analysis seems to be asking too much. These trends reflect a different enemy of science: the irrepressible urge for short-term results. The data-driven professional understands that the initial pass at the data may have been incomplete. Hypotheses must be revised. Assumptions must be revisited. New data sources must be considered. Qualitative opinions must be factored in. In other words, science is about continuous improvement in the search for answers. When an answer is found, science immediately attempts to debunk it with whatever methods make sense. If the debunking effort fails, the answer will remain as the best conclusion, at least for the moment. The data scientist will not dismiss an answer just because it is a non-quantifiable, emotional response. Science will accept an answer as the best one only if various means to disprove it have been extensively explored. In this sense, science is a non-judgmental, “show-me-what-you’ve-got” discipline.
Indeed, other non-quantifiable attributes should be considered in lieu of or in addition to the data-driven methodologies. In fact, any conclusion should be treated with skepticism, be it data-driven or not—such is the way of science. However, we must discourage knee-jerk rejections of the empirical approach merely because it doesn’t “feel” right. A blanket policy of skepticism toward testing, profiling, modeling, and other forms of data analysis is not helpful.
Gut Instinct vs. Data in Corporate America
Data can actually be used to validate hunches and predict events using empiric methodologies. In the end, the data-driven approach employs the tried-and-true scientific method in an attempt to augment, if not supersede, what we think is true. Inevitably, some results will seem counterintuitive to conventional corporate wisdom, which is the fun part for data scientists (that is, unless political motivations lurk behind the scenes). Corporate America’s resistance to big data seems to hold its practitioners back from being fully integrated into mainstream corporate functions—a sad state of affairs, given what big data has to offer.
If my estimated 50-50 ratio of science supporters to science naysayers is even remotely accurate, that’s a big problem. Because we can prove whether a particular idea pans out by using a well-designed statistical test, any arguments against taking the actions indicated by the results should be based on data flaws or problems with the methods used to analyze it. They should not be based on an individual’s intuition.
The Best Challenge to Science is Better Science
Succinctly put, one should only challenge science with better science. In some cases, the data and what it’s measuring may be mismatched. Or, the science naysayer may argue that some human behavior is just not conducive to measurement. Even so, a dialogue about how to improve data and analytical practices is far more helpful than a blatant rejection of their merit. That dialogue’s merit will depend on how the parties involved value a data-driven, scientific approach. So long as some people continue to resist the broad scientific consensus about climate change, you can be sure data scientists will remain undervalued members of corporate America.